
⇐ Previous
topic|Next topic
⇒
Table of Contents
Curvilinear regression
Summary
Use curvilinear regression when you have graphed two measurement variables and you want to fit an equation for a curved line to the points on the graph.
When to use it
Sometimes, when you analyze data with correlation and linear regression, you notice that the relationship between the independent (X) variable and dependent (Y) variable looks like it follows a curved line, not a straight line. In that case, the linear regression line will not be very good for describing and predicting the relationship, and the P value may not be an accurate test of the null hypothesis that the variables are not associated.
You have three choices in this situation. If you only want to know whether there is an association between the two variables, and you're not interested in the line that fits the points, you can use the P value from linear regression and correlation. This could be acceptable if the line is just slightly curved; if your biological question is "Does more X cause more Y?", you may not care whether a straight line or a curved line fits the relationship between X and Y better. However, it will look strange if you use linear regression and correlation on a relationship that is strongly curved, and some curved relationships, such as a U-shape, can give a non-significant P value even when the fit to a U-shaped curve is quite good. And if you want to use the regression equation for prediction or you're interested in the strength of the relationship (r2), you should definitely not use linear regression and correlation when the relationship is curved.
A second option is to do a data transformation of one or both of the measurement variables, then do a linear regression and correlation of the transformed data. There are an infinite number of possible transformations, but the common ones (log, square root, square) will make a lot of curved relationships fit a straight line pretty well. This is a simple and straightforward solution, and if people in your field commonly use a particular transformation for your kind of data, you should probably go ahead and use it. If you're using the regression equation for prediction, be aware that fitting a straight line to transformed data will give different results than fitting a curved line to the untransformed data.
Your third option is curvilinear regression: finding an equation that produces a curved line that fits your points. There are a lot of equations that will produce curved lines, including exponential (involving bX, where b is a constant), power (involving Xb), logarithmic (involving log(X)), and trigonometric (involving sine, cosine, or other trigonometric functions). For any particular form of equation involving such terms, you can find the equation for the curved line that best fits the data points, and compare the fit of the more complicated equation to that of a simpler equation (such as the equation for a straight line).
Here I will use polynomial regression as one example of curvilinear regression, then briefly mention a few other equations that are commonly used in biology. A polynomial equation is any equation that has X raised to integer powers such as X2 and X3. One polynomial equation is a quadratic equation, which has the form Ŷ=a+b1X+b2X2, where a is the y–intercept and b1 and b2 are constants. It produces a parabola. A cubic equation has the form Ŷ=a+b1X+b2X2+b3X3 and produces an S-shaped curve, while a quartic equation has the form Ŷ=a+b1X+b2X2+b3X3+b4X4 and can produce M or W shaped curves. You can fit higher-order polynomial equations, but it is very unlikely that you would want to use anything more than the cubic in biology.
Null hypotheses
One null hypothesis you can test when doing curvilinear regression is that there is no relationship between the X and Y variables; in other words, that knowing the value of X would not help you predict the value of Y. This is analogous to testing the null hypothesis that the slope is 0 in a linear regression.
You measure the fit of an equation to the data with R2, analogous to the r2 of linear regression. As you add more parameters to an equation, it will always fit the data better; for example, a quadratic equation of the form Ŷ=a+b1X+b2X2 will always be closer to the points than a linear equation of the form Ŷ=a+b1X, so the quadratic equation will always have a higher R2 than the linear. A cubic equation will always have a higher R2 than quadratic, and so on. The second null hypothesis of curvilinear regression is that the increase in R2 is only as large as you would expect by chance.
Assumptions
If you are testing the null hypothesis that there is no association between the two measurement variables, curvilinear regression assumes that the Y variable is normally distributed and homoscedastic for each value of X. Since linear regression is robust to these assumptions (violating them doesn't increase your chance of a false positive very much), I'm guessing that curvilinear regression may not be sensitive to violations of normality or homoscedasticity either. I'm not aware of any simulation studies on this, however.
Curvilinear regression also assumes that the data points are independent, just as linear regression does. You shouldn't test the null hypothesis of no association for non-independent data, such as many time series. However, there are many experiments where you already know there's an association between the X and Y variables, and your goal is not hypothesis testing, but estimating the equation that fits the line. For example, a common practice in microbiology is to grow bacteria in a medium with abundant resources, measure the abundance of the bacteria at different times, and fit an exponential equation to the growth curve. The amount of bacteria after 30 minutes is not independent of the amount of bacteria after 20 minutes; if there are more at 20 minutes, there are bound to be more at 30 minutes. However, the goal of such an experiment would not be to see whether bacteria increase in abundance over time (duh, of course they do); the goal would be to estimate how fast they grow, by fitting an exponential equation to the data. For this purpose, it doesn't matter that the data points are not independent.
Just as linear regression assumes that the relationship you are fitting a straight line to is linear, curvilinear regression assumes that you are fitting the appropriate kind of curve to your data. If you are fitting a quadratic equation, the assumption is that your data are quadratic; if you are fitting an exponential curve, the assumption is that your data are exponential. Violating this assumption—fitting a quadratic equation to an exponential curve, for example—can give you an equation that doesn't fit your data very well.
In some cases, you can pick the kind of equation to use based on a theoretical understanding of the biology of your experiment. If you are growing bacteria for a short period of time with abundant resources, you expect their growth to follow an exponential curve; if they grow for long enough that resources start to limit their growth, you expect the growth to fit a logistic curve. Other times, there may not be a clear theoretical reason for a particular equation, but other people in your field have found one that fits your kind of data well. And in other cases, you just need to try a variety of equations until you find one that works well for your data.
How the test works
In polynomial regression, you add different powers of the X variable (X, X2, X3…) to an equation to see whether they increase the R2 significantly. First you do a linear regression, fitting an equation of the form Ŷ=a+b1X to the data. Then you fit an equation of the form Ŷ=a+b1X+b2X2, which produces a parabola, to the data. The R2 will always increase when you add a higher-order term, but the question is whether the increase in R2 is significantly greater than expected due to chance. Next, you fit an equation of the form Ŷ=a+b1X+b2X2+b3X3, which produces an S-shaped line, and you test the increase in R2. You can keep doing this until adding another term does not increase R2 significantly, although in most cases it is hard to imagine a biological meaning for exponents greater than 3. Once you find the best-fitting equation, you test it to see whether it fits the data significantly better than an equation of the form Y=a; in other words, a horizontal line.
Even though the usual procedure is to test the linear regression first, then the quadratic, then the cubic, you don't need to stop if one of these is not significant. For example, if the graph looks U-shaped, the linear regression may not be significant, but the quadratic could be.
Examples
Fernandez-Juricic et al. (2003) examined the effect of human disturbance on the nesting of house sparrows (Passer domesticus). They counted breeding sparrows per hectare in 18 parks in Madrid, Spain, and also counted the number of people per minute walking through each park (both measurement variables).
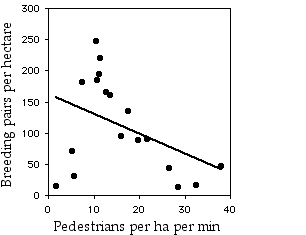
The linear regression is not significant (r2=0.174, 16 d.f., P=0.08).
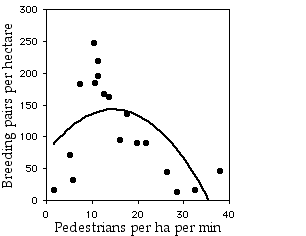
The quadratic regression is
significant (R2=0.372, 15 d.f., P=0.03), and it is
significantly better than the linear regression (P=0.03). This seems biologically plausible; the data suggest that there is some intermediate level of human traffic that is best for house sparrows. Perhaps areas with too many humans scare the sparrows away, while areas with too few humans favor other birds that outcompete the sparrows for nest sites or something.
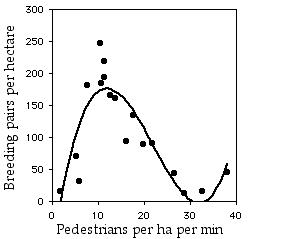
The cubic graph is
significant (R2=0.765, 14 d.f., P=0.0001), and the increase in
R2 between the cubic and the quadratic equation is highly
significant (P=1×10⁻⁵). The cubic equation is
Ŷ=−87.765+50.601X−2.916X2+0.0443X3.
The
quartic equation does not fit significantly better than the cubic equation
(P=0.80). Even though the cubic equation fits significantly better than the quadratic, it's more difficult to imagine a plausible biological explanation for this. I'd want to see more samples from areas with more than 35 people per hectare per minute before I accepted that the sparrow abundance really starts to increase again above that level of pedestrian traffic.
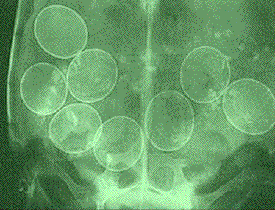
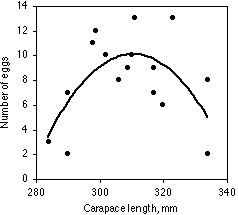
Ashton et al. (2007) measured the carapace length (in mm) of 18 female gopher tortoises (Gopherus polyphemus) in Okeeheelee County Park, Florida, and X-rayed them to count the number of eggs in each. The data are shown below in the SAS example. The linear regression is not significant (r2=0.015, 16 d.f., P=0.63), but the quadratic is significant (R2=0.43, 15 d.f., P=0.014). The increase in R2 from linear to quadratic is significant (P= 0.001). The best-fit quadratic equation is Ŷ=−899.9+5.857X−0.009425X2. Adding the cubic and quartic terms does not significantly increase the R2.
The first part of the graph is not surprising; it's easy to imagine why bigger tortoises would have more eggs. The decline in egg number above 310 mm carapace length is the interesting result; it suggests that egg production declines in these tortoises as they get old and big.
Graphing the results
As shown above, you graph a curvilinear regression the same way you would a linear regression, a scattergraph with the independent variable on the X axis and the dependent variable on the Y axis. In general, you shouldn't show the regression line for values outside the range of observed X values, as extrapolation with polynomial regression is even more likely than linear regression to yield ridiculous results. For example, extrapolating the quadratic equation relating tortoise carapace length and number of eggs predicts that tortoises with carapace length less than 279 mm or greater than 343 mm would have negative numbers of eggs.
Similar tests
Before performing a curvilinear regression, you should try different transformations when faced with an obviously curved relationship between an X and a Y variable. A linear equation relating transformed variables is simpler and more elegant than a curvilinear equation relating untransformed variables. You should also remind yourself of your reason for doing a regression. If your purpose is prediction of unknown values of Y corresponding to known values of X, then you need an equation that fits the data points well, and a polynomial regression may be appropriate if transformations do not work. However, if your purpose is testing the null hypothesis that there is no relationship between X and Y, and a linear regression gives a significant result, you may want to stick with the linear regression even if curvilinear gives a significantly better fit. Using a less-familiar technique that yields a more-complicated equation may cause your readers to be a bit suspicious of your results; they may feel you went fishing around for a statistical test that supported your hypothesis, especially if there's no obvious biological reason for an equation with terms containing exponents.
Spearman rank correlation is a nonparametric test of the association between two variables. It will work well if there is a steady increase or decrease in Y as X increases, but not if Y goes up and then goes down.
Polynomial regression is a form of multiple regression. In multiple regression, there is one dependent (Y) variable and multiple independent (X) variables, and the X variables (X1, X2, X3...) are added to the equation to see whether they increase the R2 significantly. In polynomial regression, the independent "variables" are just X, X2, X3, etc.
How to do the test
Spreadsheet
I have prepared a spreadsheet that will help you perform a polynomial regression. It tests equations up to quartic, and it will handle up to 1000 observations.
Web pages
There is a very powerful web page that will fit just about any equation you can think of to your data (not just polynomial).
R
Salvatore Mangiafico's R Companion has sample R programs for polynomial regression and other forms of regression that I don't discuss here (B-spline regression and other forms of nonlinear regression).
SAS
To do polynomial regression in SAS, you create a data set containing the square of the independent variable, the cube, etc. You then use PROC REG for models containing the higher-order variables. It's possible to do this as a multiple regression, but I think it's less confusing to use multiple model statements, adding one term to each model. There doesn't seem to be an easy way to test the significance of the increase in R2 in SAS, so you'll have to do that by hand. If R2i is the R2 for the ith order, and R2j is the R2 for the next higher order, and d.f.j is the degrees of freedom for the higher-order equation, the F-statistic is d.f.j×(R2j−R2i)/(1−R2j). It has j degrees of freedom in the numerator and d.f.j=n−j−1 degrees of freedom in the denominator.
Here's an example, using the data on tortoise carapace length and clutch size from Ashton et al. (2007).
DATA turtles;
   INPUT length clutch;
   length2=length*length;
   length3=length*length*length;
   length4=length*length*length*length;
   DATALINES;
284     3
290     2
290     7
290     7
298     11
299     12
302     10
306     8
306     8
309     9
310     10
311     13
317     7
317     9
320     6
323     13
334     2
334     8
;
PROC REG DATA=TURTLES;
   MODEL clutch=length;
   MODEL clutch=length length2;
   MODEL clutch=length length2 length3;
   RUN;
In the output, first look for the R2 values under each model:
                    The REG Procedure
                     Model: MODEL1
                 Dependent Variable: clutch
                         .
                         .
                         .
Root MSE              3.41094    R-Square    0.0148 linear R-sq
Dependent Mean        8.05556    Adj R-Sq   -0.0468
Coeff Var            42.34268
                         .
                         .
                         .
                   The REG Procedure
                      Model: MODEL2
                Dependent Variable: clutch
                         .
                         .
                         .
Root MSE              2.67050    R-Square    0.4338 quadratic R-sq
Dependent Mean        8.05556    Adj R-Sq    0.3583
Coeff Var            33.15104
For this example, n=18. The F-statistic for the increase in R2 from linear to quadratic is 15×(0.4338−0.0148)/(1−0.4338)=11.10 with d.f.=2, 15. Using a spreadsheet (enter =FDIST(11.10, 2, 15)), this gives a P value of 0.0011. So the quadratic equation fits the data significantly better than the linear equation.
Once you've figured out which equation is best (the quadratic, for our example, since the cubic and quartic equations do not significantly increase the R2), look for the parameters in the output:
                      Parameter Estimates

                    Parameter     Standard
Variable     DF      Estimate        Error   t Value   Pr > |t|

Intercept     1    -899.93459    270.29576     -3.33     0.0046
length        1       5.85716      1.75010      3.35     0.0044
length2       1      -0.00942      0.00283     -3.33     0.0045
This tells you that the equation for the best-fit quadratic curve is Ŷ=−899.9+5.857X−0.009425X2.
References
Ashton, K.G., R.L. Burke, and J.N. Layne. 2007. Geographic variation in body and clutch size of gopher tortoises. Copeia 2007: 355-363.
Fernandez-Juricic, E., A. Sallent, R. Sanz, and I. Rodriguez-Prieto. 2003. Testing the risk-disturbance hypothesis in a fragmented landscape: non-linear responses of house sparrows to humans. Condor 105: 316-326.
⇐ Previous
topic|Next topic
⇒
Table of Contents
This page was last revised July 20, 2015. Its address is http://www.biostathandbook.com/curvilinearregression.html. It may be cited as:
McDonald, J.H. 2014. Handbook of Biological Statistics (3rd ed.). Sparky House Publishing, Baltimore, Maryland. This web page contains the content of pages 213-219 in the printed version.
©2014 by John H. McDonald. You can probably do what you want with this content; see the permissions page for details.