⇐ Previous topic|Next topic ⇒
Table of Contents
Standard error of the mean
Summary
Standard error of the mean tells you how accurate your estimate of the mean is likely to be.
Introduction
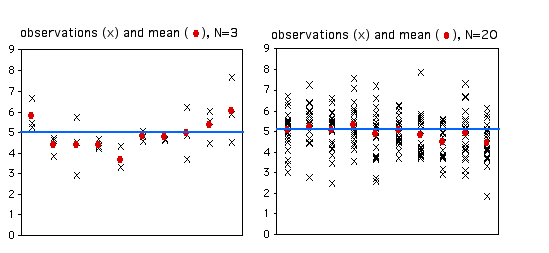
When you take a sample of observations from a population and calculate the sample mean, you are estimating of the parametric mean, or mean of all of the individuals in the population. Your sample mean won't be exactly equal to the parametric mean that you're trying to estimate, and you'd like to have an idea of how close your sample mean is likely to be. If your sample size is small, your estimate of the mean won't be as good as an estimate based on a larger sample size. Here are 10 random samples from a simulated data set with a true (parametric) mean of 5. The X's represent the individual observations, the red circles are the sample means, and the blue line is the parametric mean.
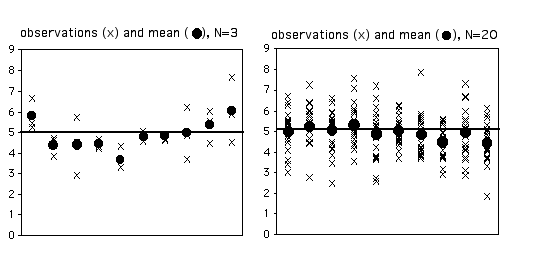
As you can see, with a sample size of only 3, some of the sample means aren't very close to the parametric mean. The first sample happened to be three observations that were all greater than 5, so the sample mean is too high. The second sample has three observations that were less than 5, so the sample mean is too low. With 20 observations per sample, the sample means are generally closer to the parametric mean.
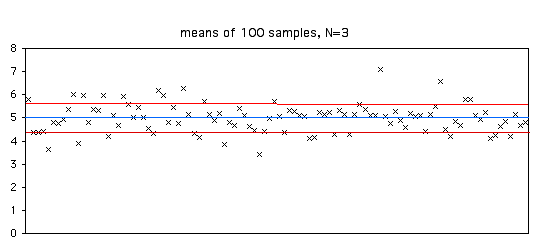
Once you've calculated the mean of a sample, you should let people know how close your sample mean is likely to be to the parametric mean. One way to do this is with the standard error of the mean. If you take many random samples from a population, the standard error of the mean is the standard deviation of the different sample means. About two-thirds (68.3%) of the sample means would be within one standard error of the parametric mean, 95.4% would be within two standard errors, and almost all (99.7%) would be within three standard errors.
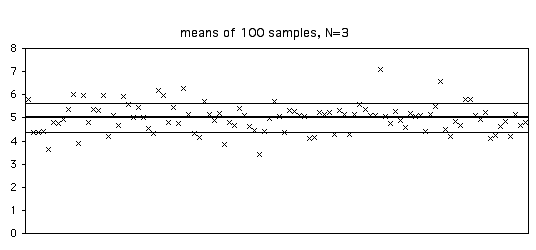
Here's a figure illustrating this. I took 100 samples of 3 from a population with a parametric mean of 5 (shown by the blue line). The standard deviation of the 100 means was 0.63. Of the 100 sample means, 70 are between 4.37 and 5.63 (the parametric mean ±one standard error).
Usually you won't have multiple samples to use in making multiple estimates of the mean. Fortunately, you can estimate the standard error of the mean using the sample size and standard deviation of a single sample of observations. The standard error of the mean is estimated by the standard deviation of the observations divided by the square root of the sample size. For some reason, there's no spreadsheet function for standard error, so you can use =STDEV(Ys)/SQRT(COUNT(Ys)), where Ys is the range of cells containing your data.
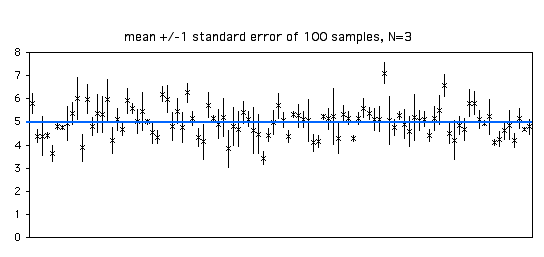
This figure is the same as the one above, only this time I've added error bars indicating ±1 standard error. Because the estimate of the standard error is based on only three observations, it varies a lot from sample to sample.
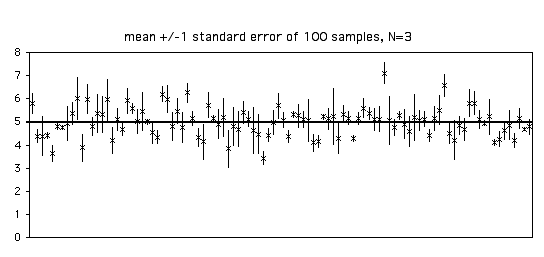
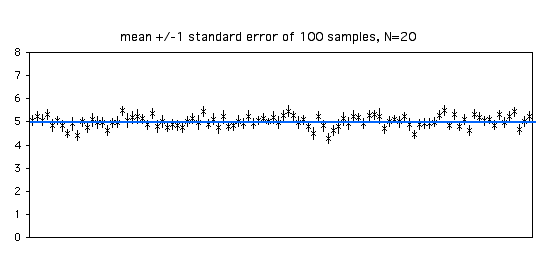
With a sample size of 20, each estimate of the standard error is more accurate. Of the 100 samples in the graph below, 68 include the parametric mean within ±1 standard error of the sample mean.
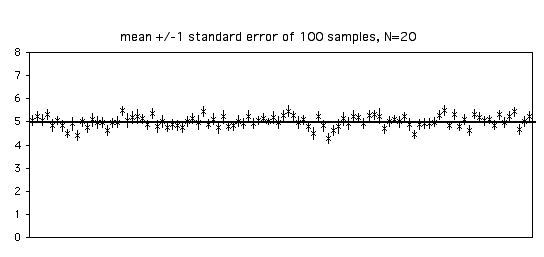
As you increase your sample size, the standard error of the mean will become smaller. With bigger sample sizes, the sample mean becomes a more accurate estimate of the parametric mean, so the standard error of the mean becomes smaller. Note that it's a function of the square root of the sample size; for example, to make the standard error half as big, you'll need four times as many observations.
"Standard error of the mean" and "standard deviation of the mean" are equivalent terms. People almost always say "standard error of the mean" to avoid confusion with the standard deviation of observations. Sometimes "standard error" is used by itself; this almost certainly indicates the standard error of the mean, but because there are also statistics for standard error of the variance, standard error of the median, standard error of a regression coefficient, etc., you should specify standard error of the mean.
There is a myth that when two means have standard error bars that don't overlap, the means are significantly different (at the P<0.05 level). This is not true (Browne 1979, Payton et al. 2003); it is easy for two sets of numbers to have standard error bars that don't overlap, yet not be significantly different by a two-sample t–test. Don't try to do statistical tests by visually comparing standard error bars, just use the correct statistical test.
Similar statistics
Confidence intervals and standard error of the mean serve the same purpose, to express the reliability of an estimate of the mean. When you look at scientific papers, sometimes the "error bars" on graphs or the ± number after means in tables represent the standard error of the mean, while in other papers they represent 95% confidence intervals. I prefer 95% confidence intervals. When I see a graph with a bunch of points and error bars representing means and confidence intervals, I know that most (95%) of the error bars include the parametric means. When the error bars are standard errors of the mean, only about two-thirds of the error bars are expected to include the parametric means; I have to mentally double the bars to get the approximate size of the 95% confidence interval. In addition, for very small sample sizes, the 95% confidence interval is larger than twice the standard error, and the correction factor is even more difficult to do in your head. Whichever statistic you decide to use, be sure to make it clear what the error bars on your graphs represent. I have seen lots of graphs in scientific journals that gave no clue about what the error bars represent, which makes them pretty useless.
You use standard deviation and coefficient of variation to show how much variation there is among individual observations, while you use standard error or confidence intervals to show how good your estimate of the mean is. The only time you would report standard deviation or coefficient of variation would be if you're actually interested in the amount of variation. For example, if you grew a bunch of soybean plants with two different kinds of fertilizer, your main interest would probably be whether the yield of soybeans was different, so you'd report the mean yield ± either standard error or confidence intervals. If you were going to do artificial selection on the soybeans to breed for better yield, you might be interested in which treatment had the greatest variation (making it easier to pick the fastest-growing soybeans), so then you'd report the standard deviation or coefficient of variation.
There's no point in reporting both standard error of the mean and standard deviation. As long as you report one of them, plus the sample size (N), anyone who needs to can calculate the other one.
Example
The standard error of the mean for the blacknose dace data from the central tendency web page is 10.70.
How to calculate the standard error
Spreadsheet
The descriptive statistics spreadsheet calculates the standard error of the mean for up to 1000 observations, using the function =STDEV(Ys)/SQRT(COUNT(Ys)).
Web pages
This web page calculates standard error of the mean and other descriptive statistics for up to 10000 observations.
This web page calculates standard error of the mean, along with other descriptive statistics. I don't know the maximum number of observations it can handle.
R
Salvatore Mangiafico's R Companion has a sample R program for standard error of the mean.
SAS
PROC UNIVARIATE will calculate the standard error of the mean. For examples, see the central tendency web page.
References
Browne, R. H. 1979. On visual assessment of the significance of a mean difference. Biometrics 35: 657-665.
Payton, M. E., M. H. Greenstone, and N. Schenker. 2003. Overlapping confidence intervals or standard error intervals: what do they mean in terms of statistical significance? Journal of Insect Science 3: 34.
⇐ Previous topic|Next topic ⇒
Table of Contents
This page was last revised July 20, 2015. Its address is http://www.biostathandbook.com/standarderror.html. It may be cited as:
McDonald, J.H. 2014. Handbook of Biological Statistics (3rd ed.). Sparky House Publishing, Baltimore, Maryland. This web page contains the content of pages 111-114 in the printed version.
©2014 by John H. McDonald. You can probably do what you want with this content; see the permissions page for details.

